
View local data and figures below. For more information, visit the Colorado Climate Center and Colorado River Basin Forecast Center
Stream Gages
USGS gages across the watershed. Click the name of the gage below the hydrograph to be directed to their USGS site.
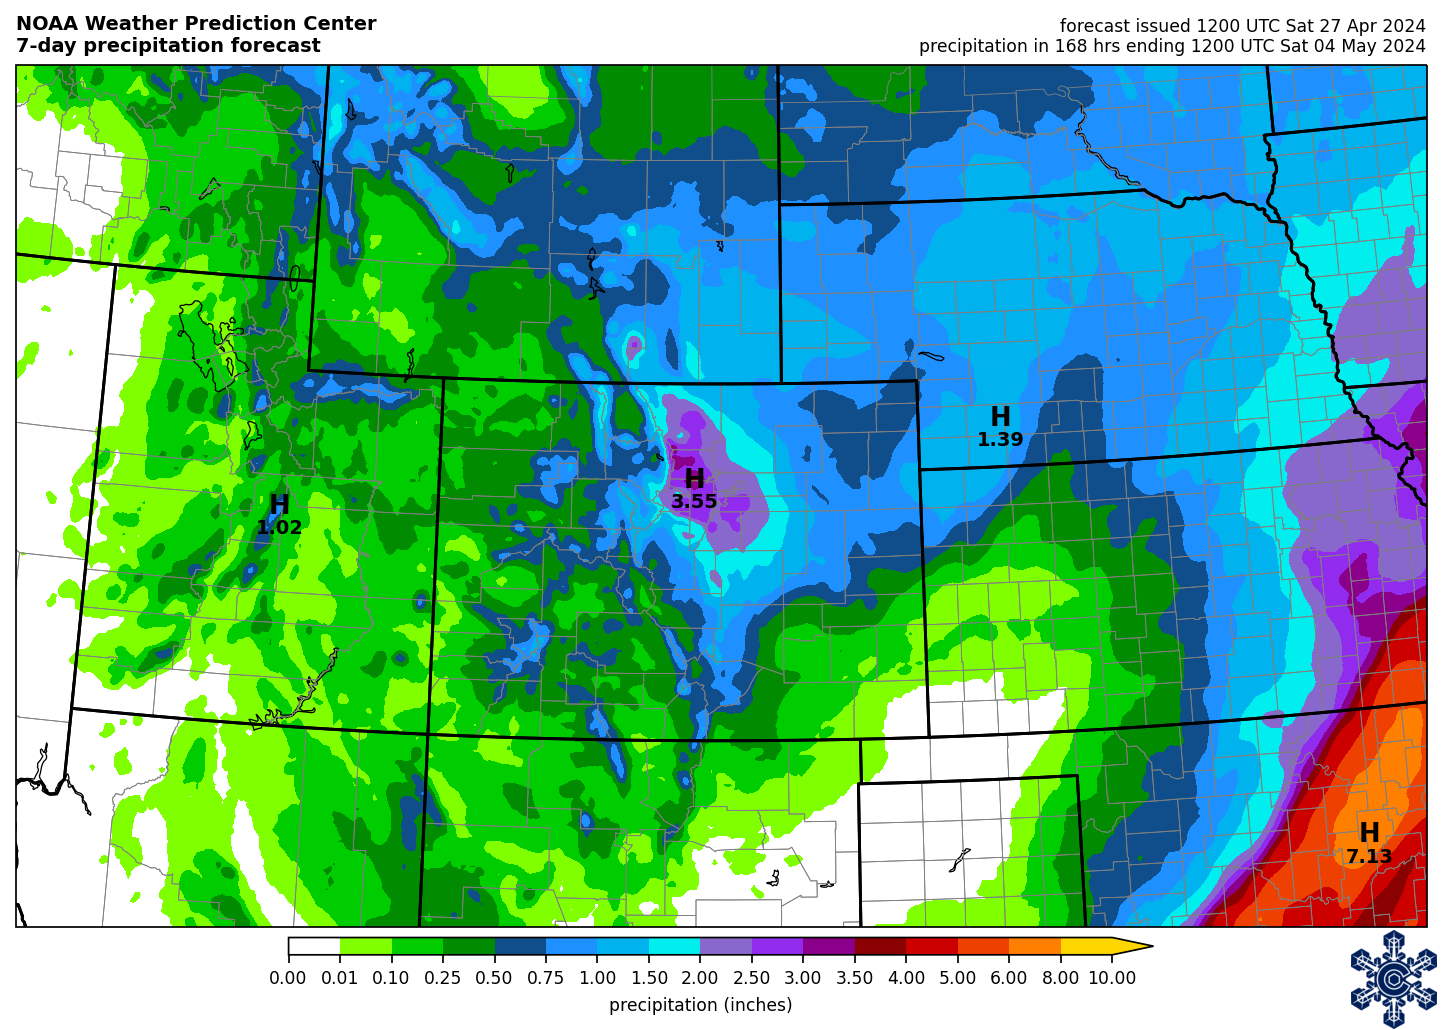
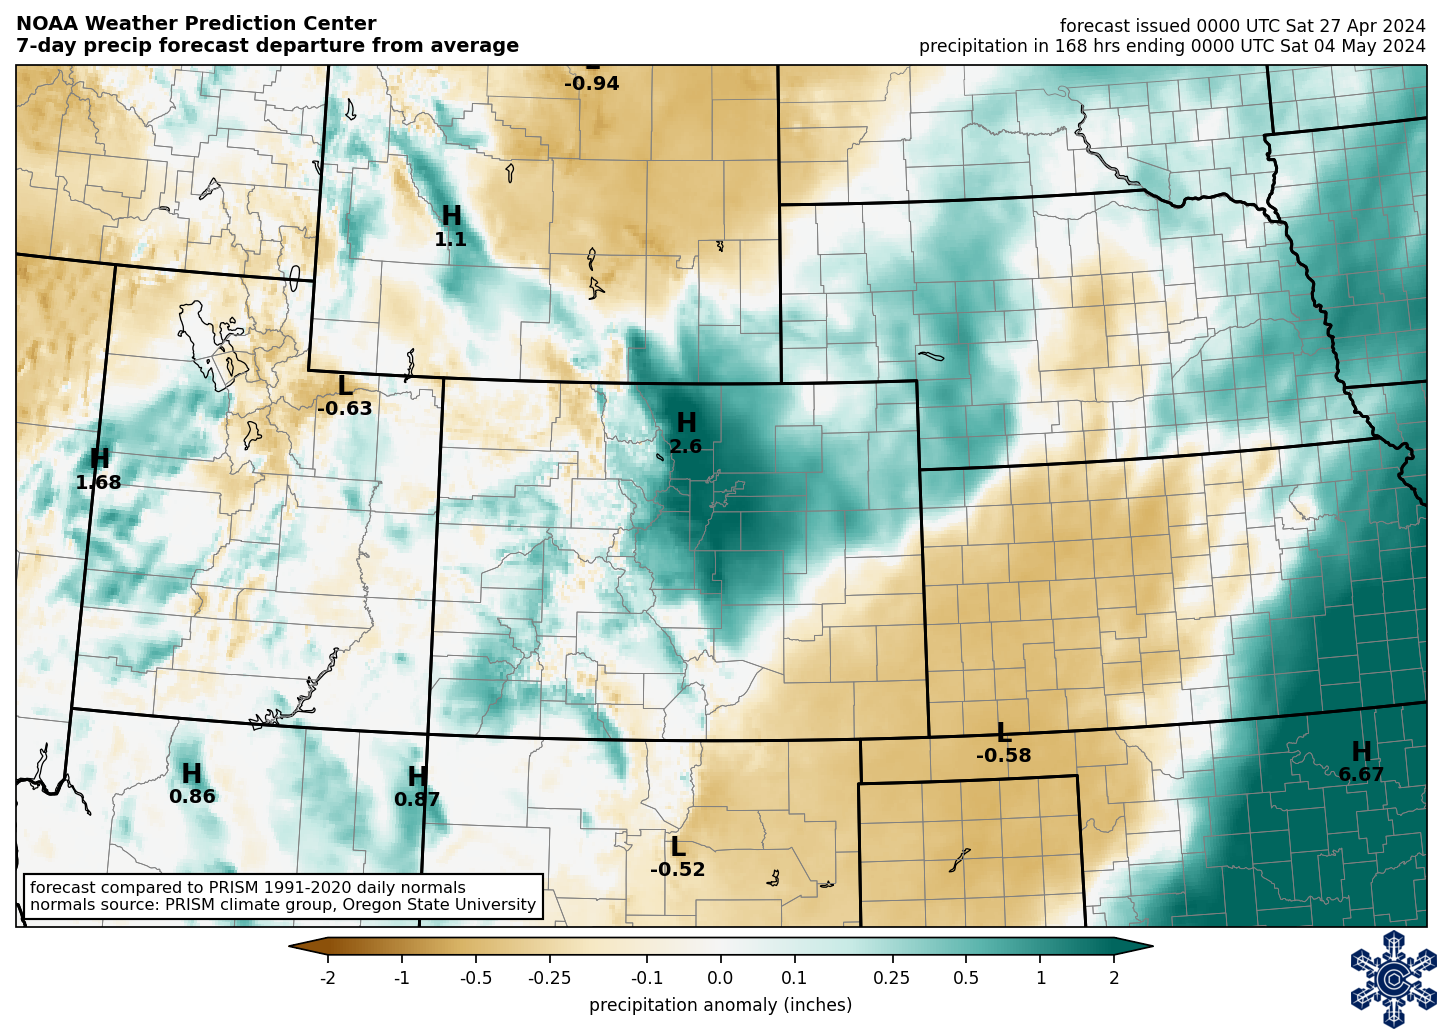
7-Day Precipitation Forecast and Departure From Average
14-Day NOAA Outlook


Colorado Drought Monitor

Seasonal Precipitation Outlook

Seasonal Temperature Outlook

Monthly Temperature Anomaly
Colorado River Basin Forecast Center
The CRBFC is a NOAA forecast center dedicated to the entire Colorado River Basin to inform decision making with a variety of modeled products including long range water supply, short range river flow forecast and peak flow forecast. The CRBFC sites use USGS gage station locations for modeled forecasts. The CRBFC models use USGS gage stations designated for reservoir management for long term water supply forecasts. In the San Miguel this is the Placerville gage, which is associated with the congressionally improved but infeasible San Miguel Project.


